Before it, a dead channel could stay dark for 10 to 15 hours until a customer called in. Now every channel, recorder, storage node, edge server and set-top-box signal is watched continuously, and the team sees a fault on the dashboard and the TV wall within seconds.
My roleDesigner, builder and operator, end to end
Built7 Aug 2026 to today, 1,318 commits
Scale193 channels, 42 servers, 29 GUI pages
CodeAbout 103,800 lines in 9 components
Runs on68 timers, 75 services, one monitoring host
Before and after
Before (2026, per Monjur)
10 to 15 h
No monitoring existed. A channel could be down for 10 to 15 hours. A customer noticed, opened a ticket, the support team found out, escalated to the channel-feed vendor, and only then was it fixed.
After
Seconds
Every channel checked every 30 seconds. The TV-wall view refreshes about every 15 seconds and the dashboard shows the fault at once (Monjur: about 5 seconds to see a down or drifting channel). A confirmed customer-facing fault posts a Webex card after a deliberate 30-minute confirm hold, so management never sees a false alarm.
How a fault was found before
Channel goes dark→Hours pass→Customer calls→Ticket opened→Team learns→Vendor escalation→Fixed, 10 to 15 h later
How a fault is found now
Recorder error or feed drops→Detector sees it inside 30 s→Dashboard and wall show it→Gate confirms it is real→Card to the right Webex space→Team and vendor act before customers call
Recorded proof, 9 Aug 2026. The first major vendor outage after go-live: the first channel lost its feed at 19:00:40, all 148 affected channels registered within 51 seconds, and the first alert fired at 19:02:01, 81 seconds after the first loss, before a single customer call. That night also showed the alert flood (211 cards in 41 minutes), which led to the mass-outage gate that now turns it into 5.
Every blind spot became a detector
Date
What customers found first
What I built
20 Aug 2026
Boxes showed "No EPG" for about 3 hours; the guide servers answered HTTP 200 with an empty 51-byte page
EPG request health: each hour compared with the same hour on the last 7 days
28 Jul to 17 Aug
Wall bot looked "up" while 97% of its polls (53,670 of 55,241) failed
The rule "running is not working" and freshness watchdogs on every feed
20 Sep 2026
A channel dead for about 5.5 hours with one card and no reminder
Source-dead detector with its own 4-hourly reminder and guaranteed recovery row
14 Oct 2026
A storage-cluster outage took IPTV down
Ceph guard (every minute), platform watch and vendor watch
19 to 20 Oct
20-second stalls hit 6 to 15 homes at once on sports channels with no card
Fleet-stall detector (built 23 Oct) plus an engine "blind" card
1 Nov 2026
Three false red cards for one channel that was playing
Pre-post gate: no card reaches management unless held, agreed and complete
How it was built
Day one, 7 Aug 2026. A four-plane design: detection engine, collectors, web GUI, host runtime. First commit carried 30 collectors, 43 engine modules, 18 job wrappers and a multi-page GUI.
Connected the data. SmartCARE (set-top-box and recorder telemetry), recorder feed rates, DASH manifests, ELK box logs, Ceph, Proxmox, LibreNMS, the provisioning logs, the guide servers and the Nexto wall controller, all read-only.
Routed alerts by customer impact (8 Sep). "Would a customer phone in about this?" Yes goes to IPTV Service Alerts for the support team; no goes to the infrastructure space for engineers. Yellow signals stay on the web pages.
Made it trustworthy. Confirm holds, recovery only after a real red card, a mass-outage gate, a pre-post gate, kill switches and shadow mode for every new detector.
Grew the GUI to 29 pages covering channels, storage, edges, servers, capacity, recordings, provisioning, reports and the TV wall.
Hardened operations. Eight repositories merged into one monorepo, git-first deploys with automatic rollback, drift checks against git, contracts for every job, nightly off-box backups.
The GUI
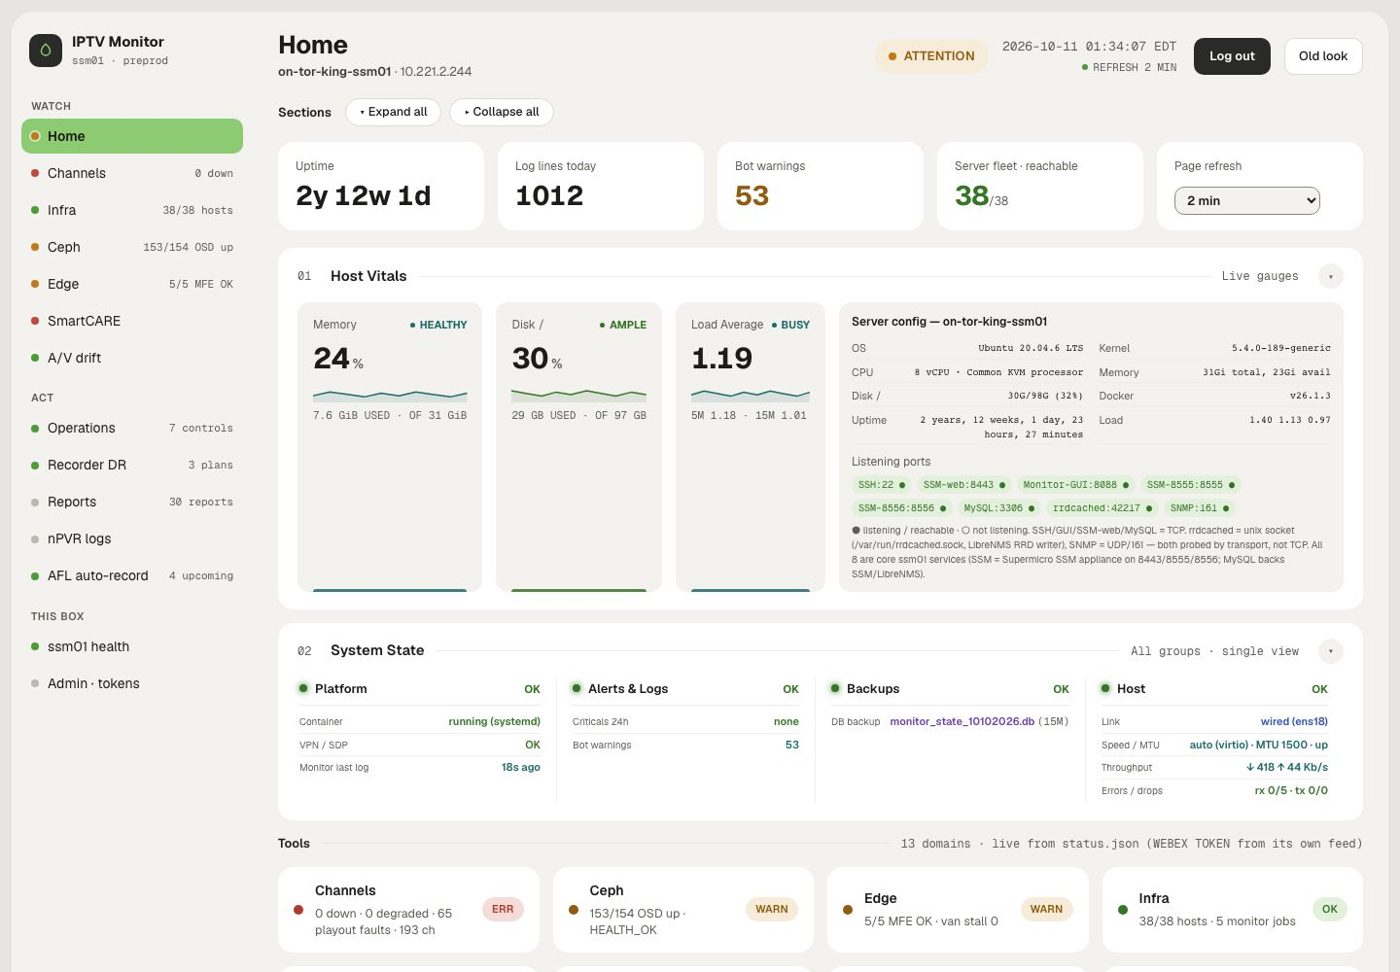
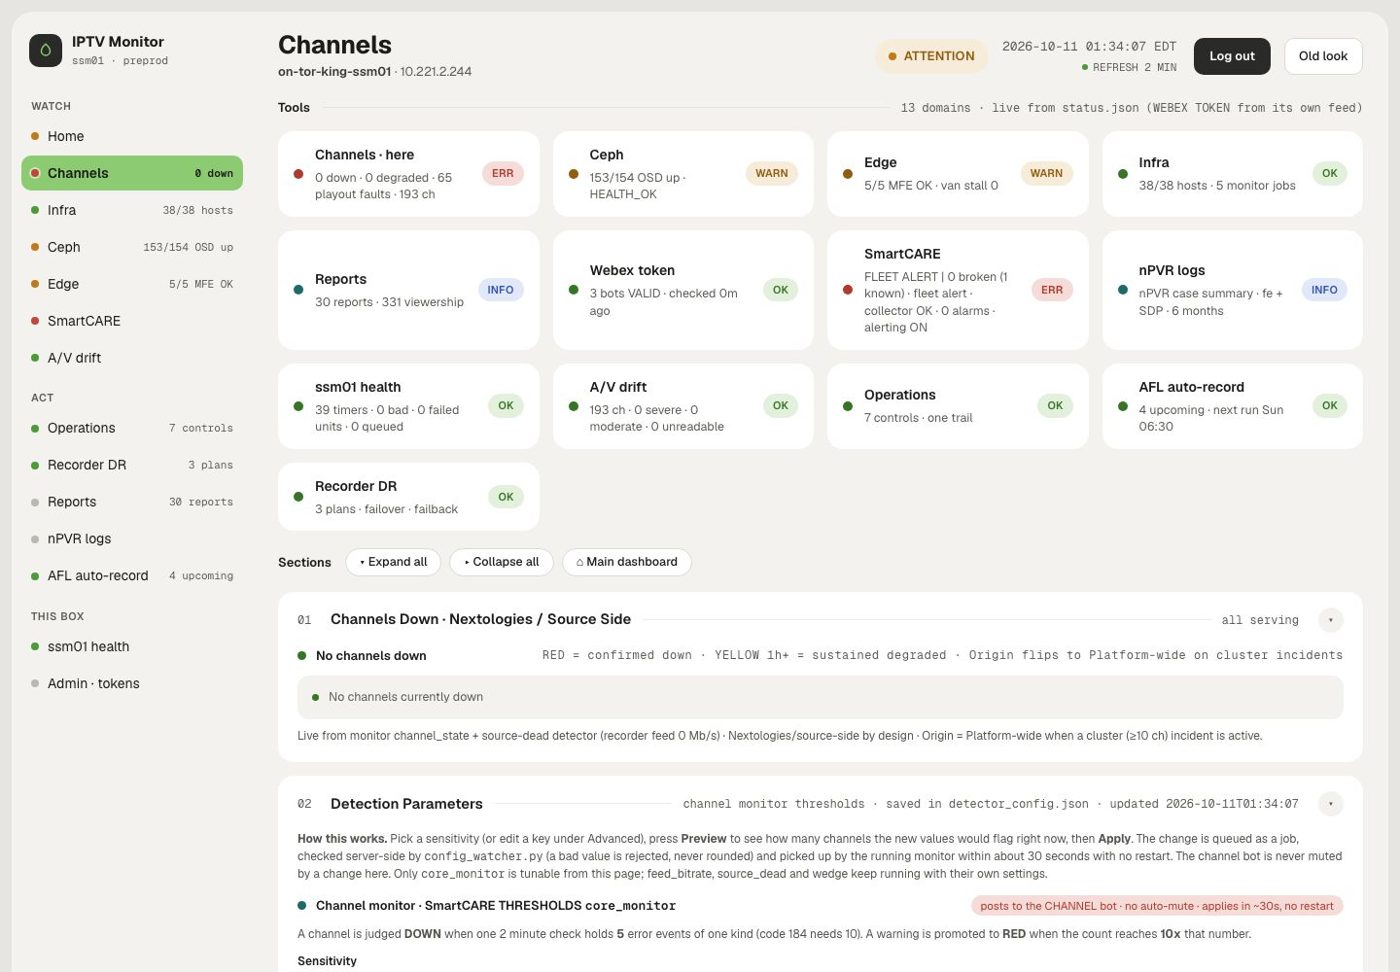
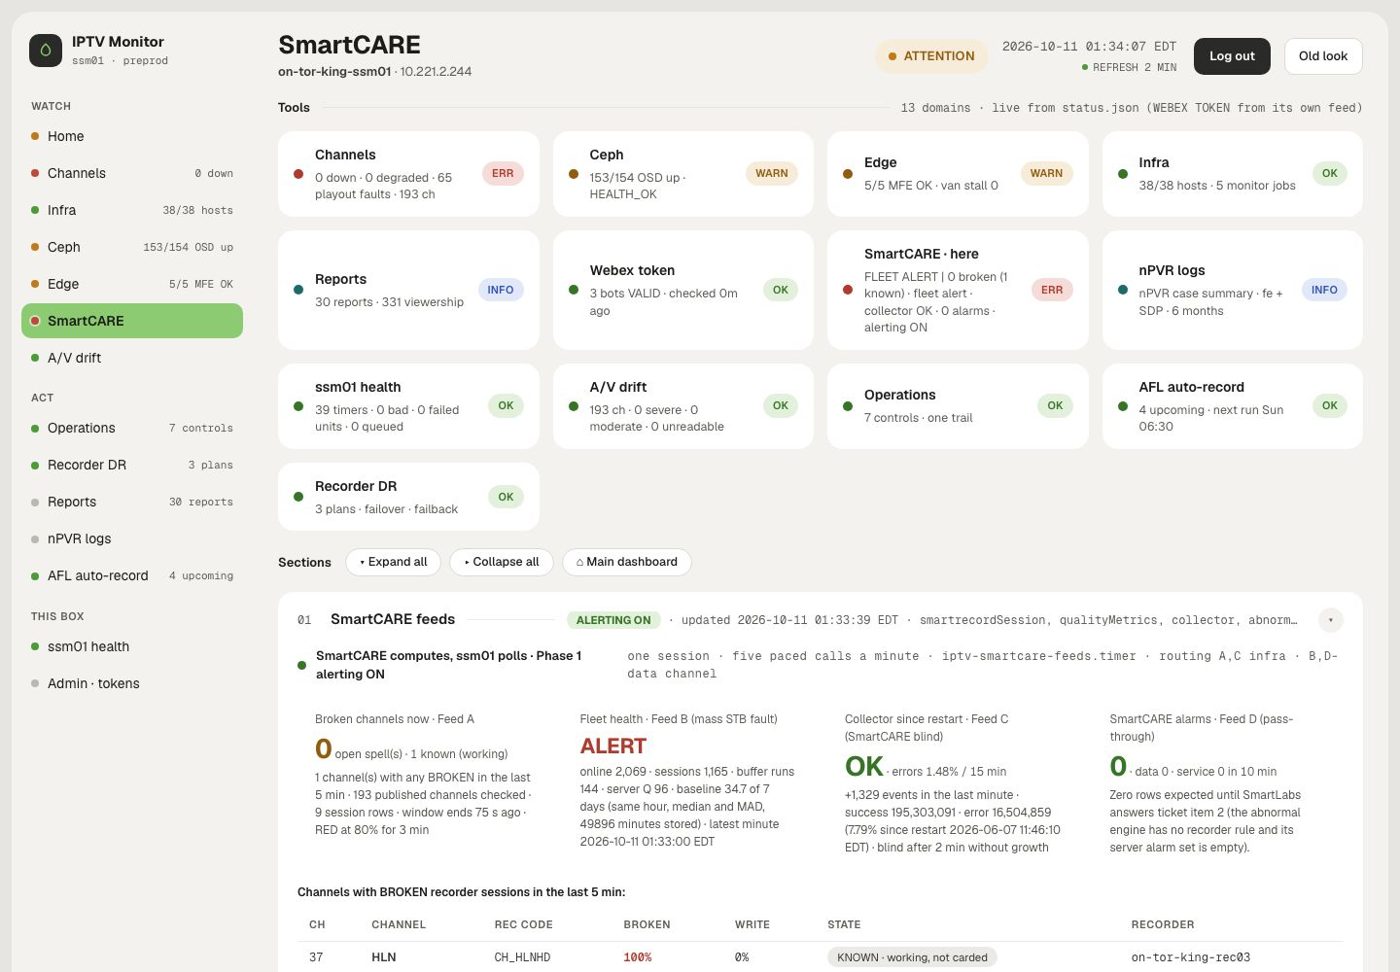
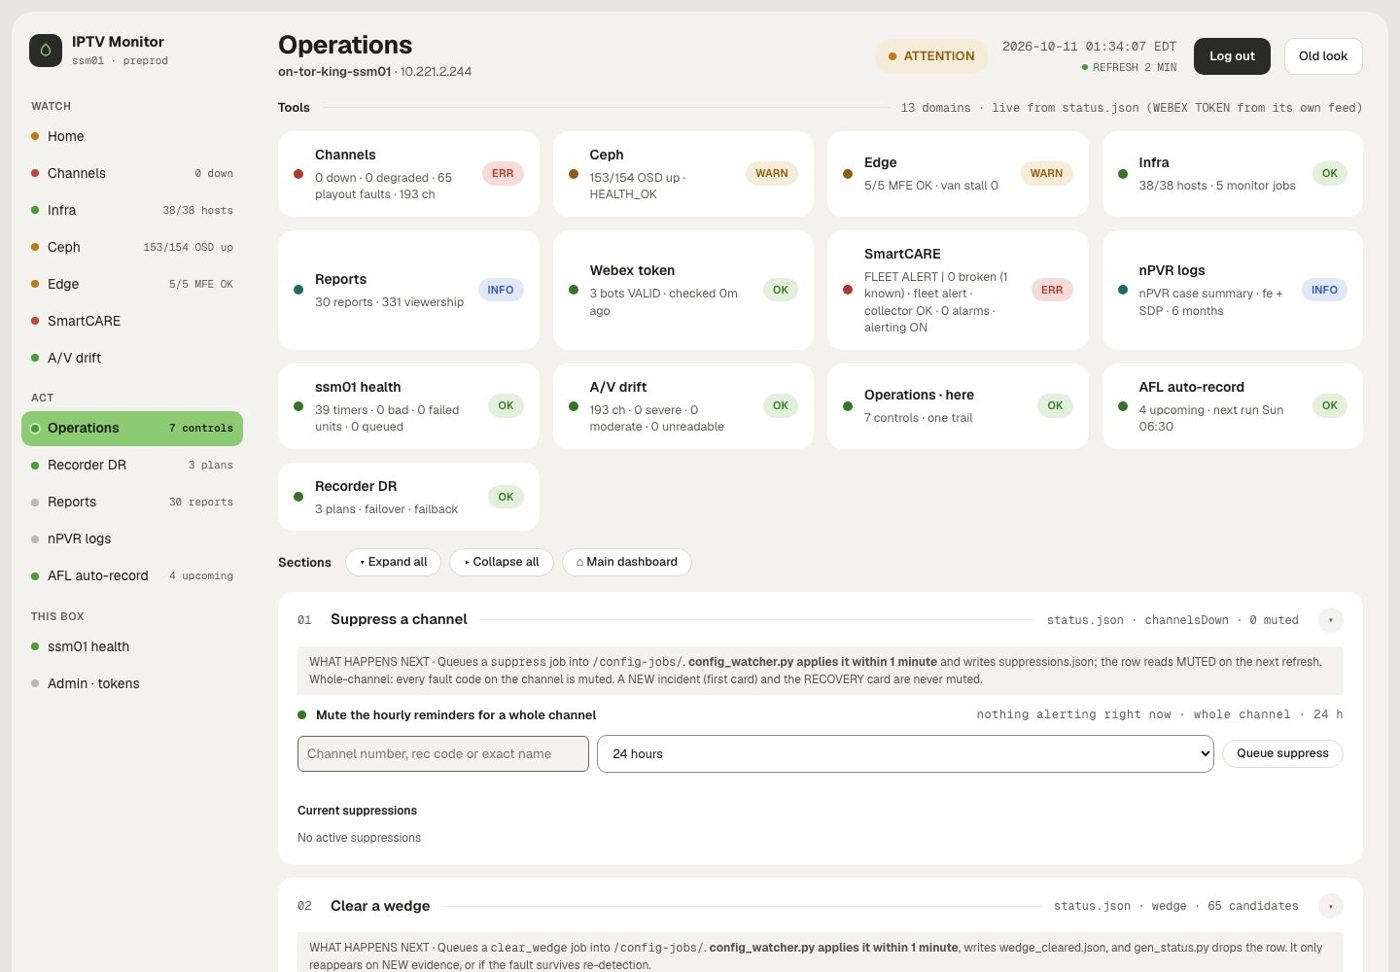
One web dashboard on the IPTV VPN. A home page of live tiles, one per area, then host vitals, system state, a tools grid, channel alert history and a channel directory. Two looks: Elera (light, the default since 11 Oct 2026, a left rail grouped Watch / Act / This box) and the original dark look, one click away.
Home: live tiles, host vitals, system state.
Channels: down channels, detection parameters, suppress
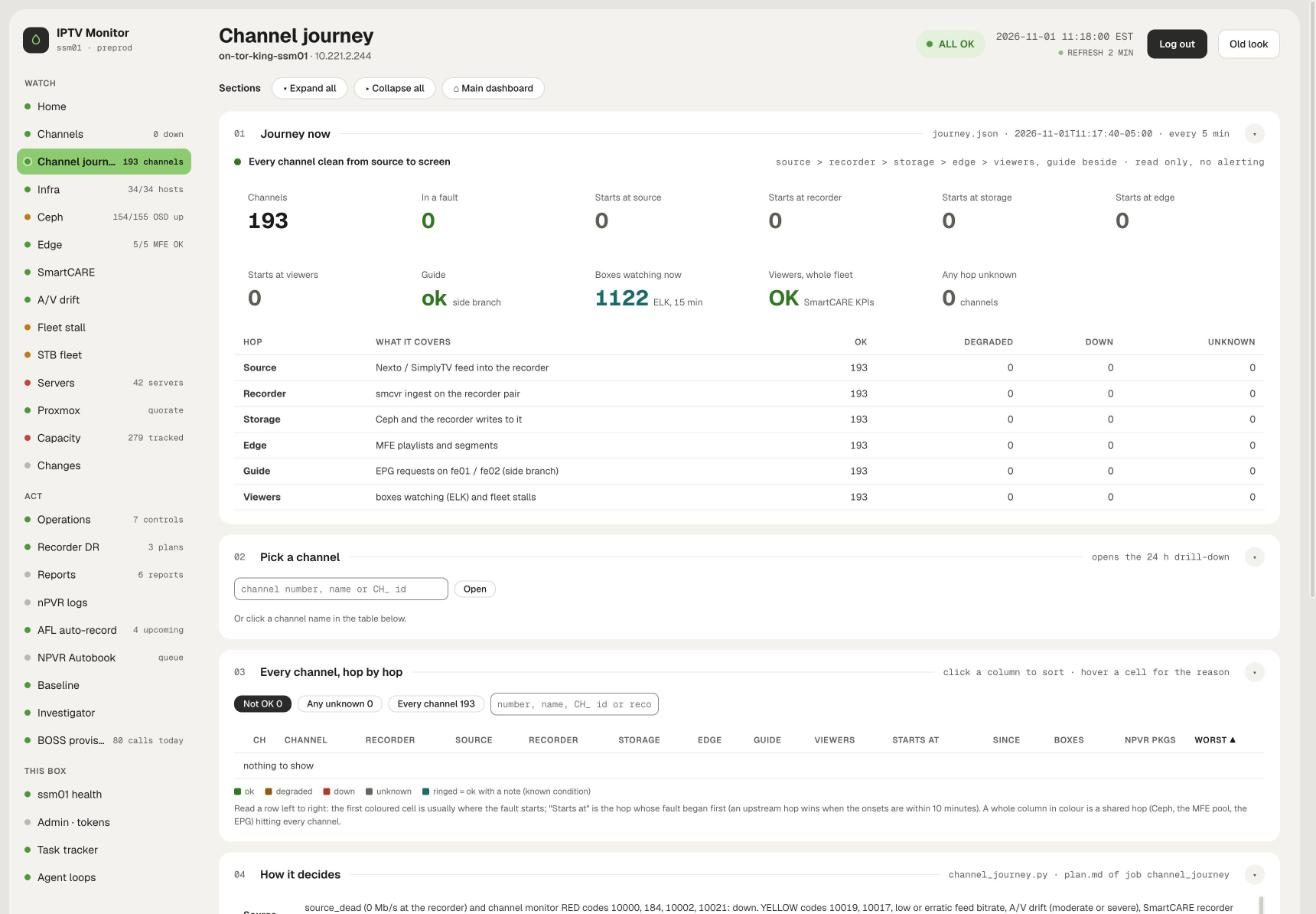
Channel journey: source to screen, hop by hop
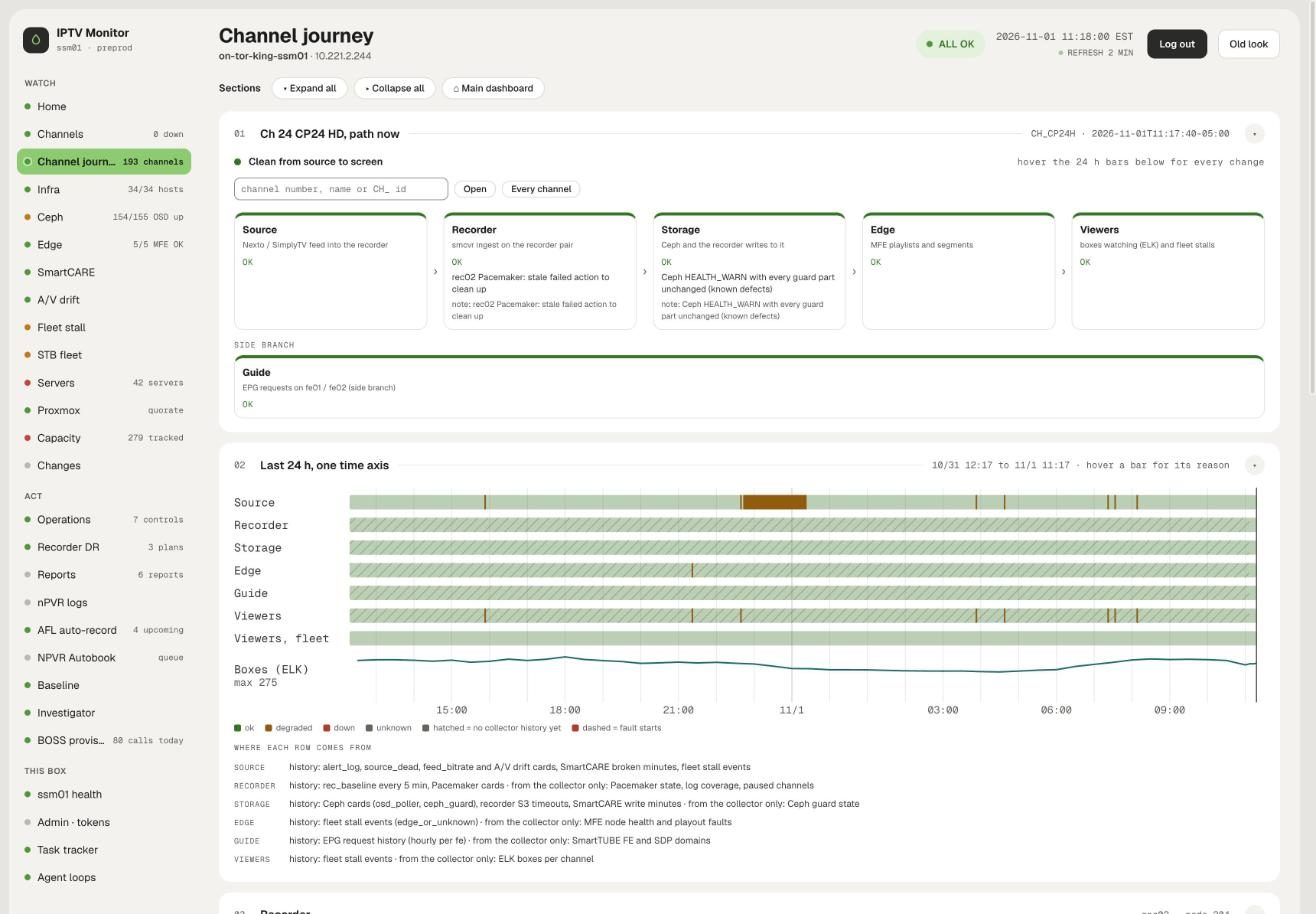
One channel: path and 24-hour axis
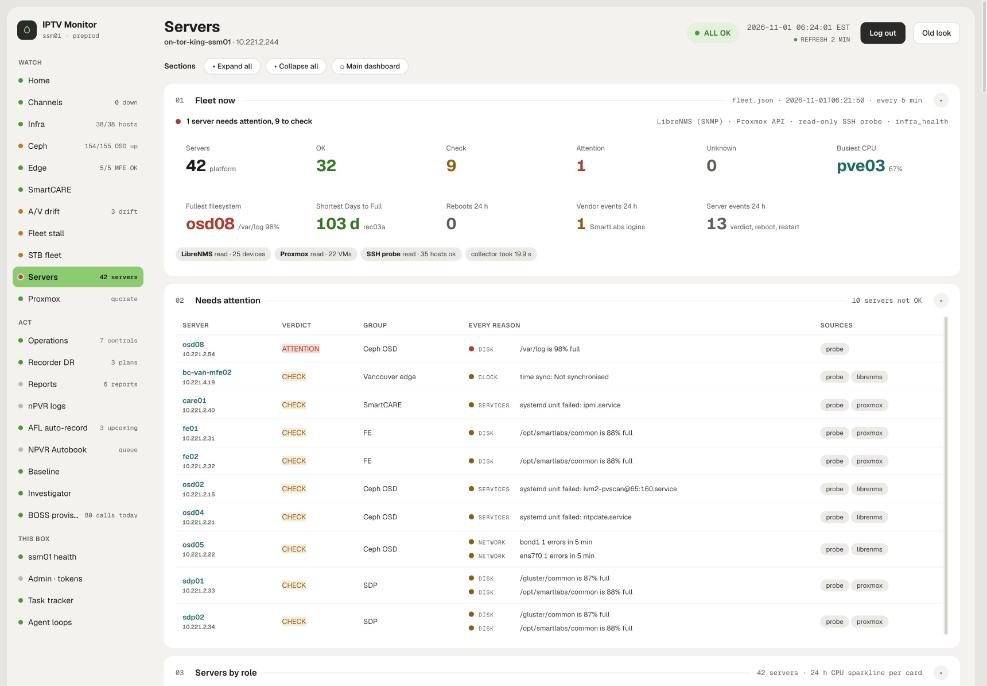
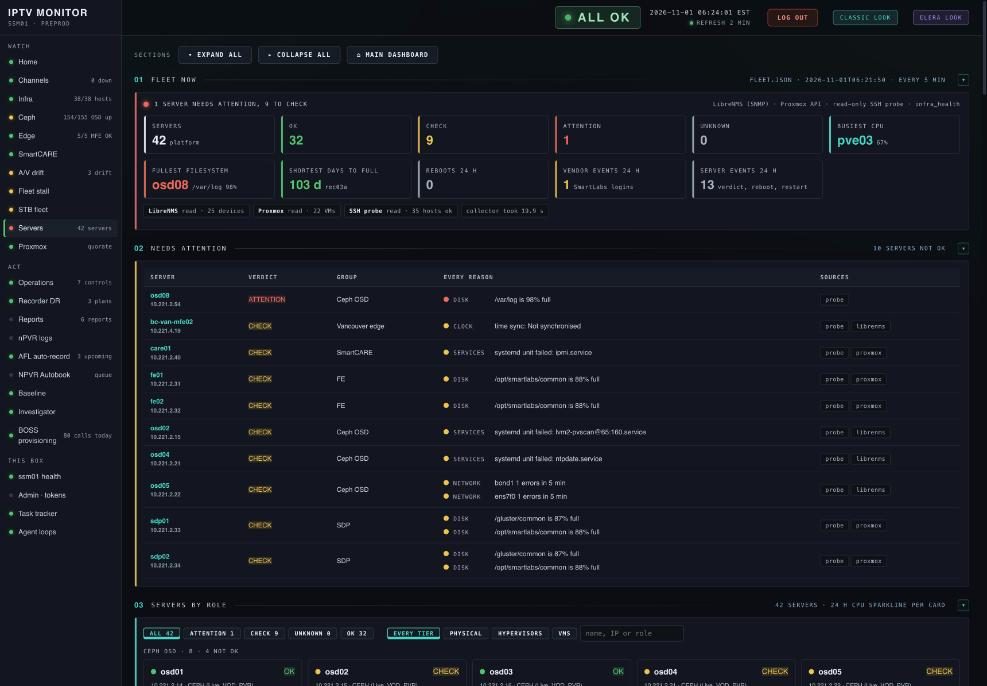
Servers: 42 platform servers graded OK, CHECK, ATTENTION or UNKNOWN
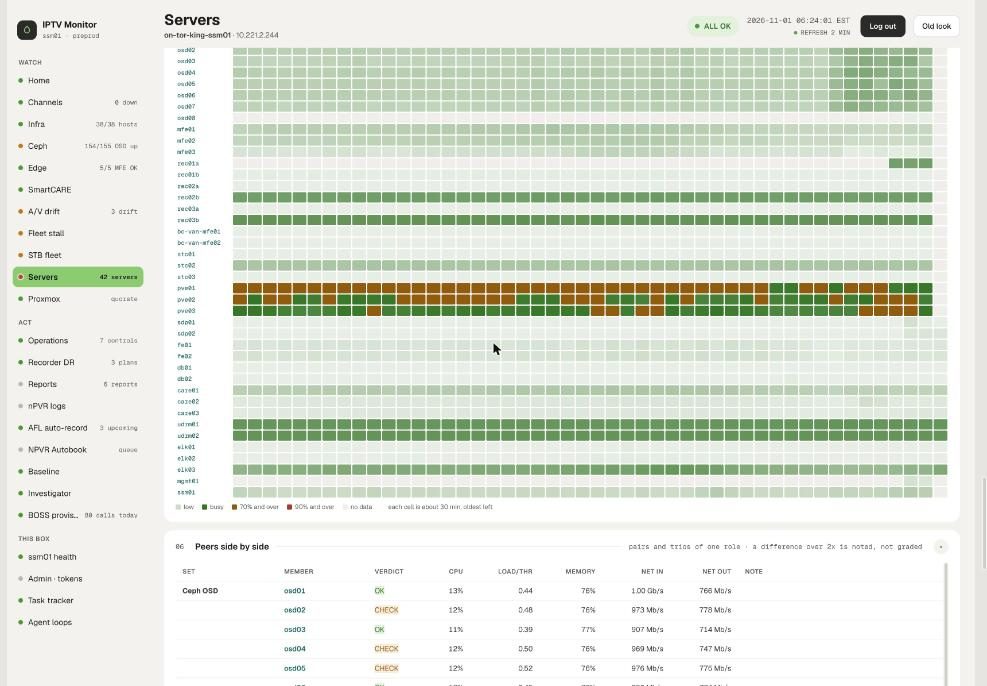
CPU heatmap and peers side by side
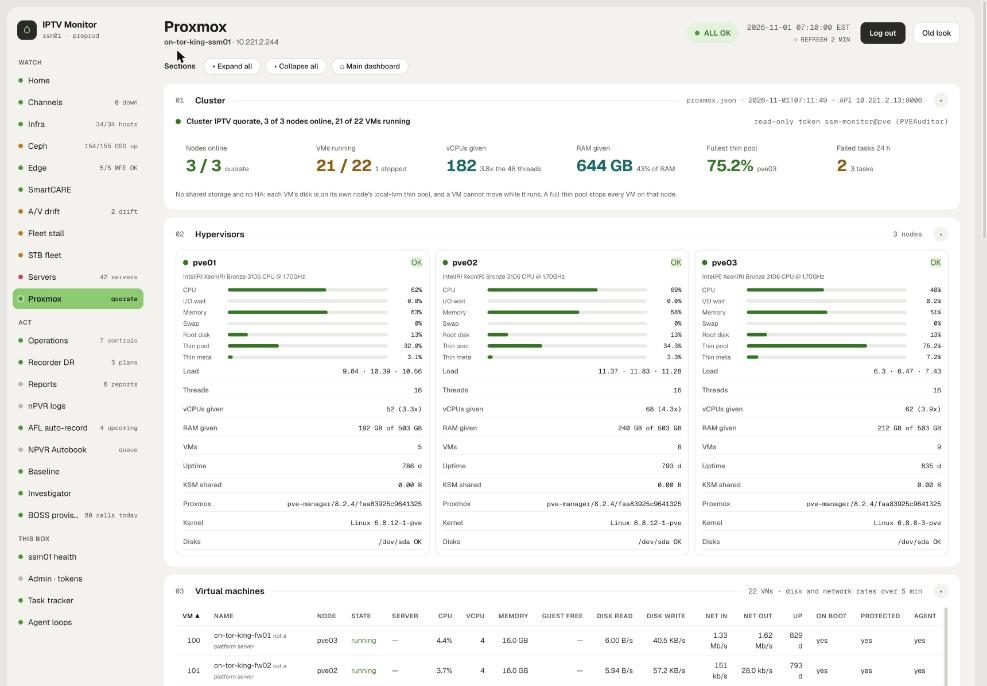
Proxmox: cluster, hypervisors, 22 VMs
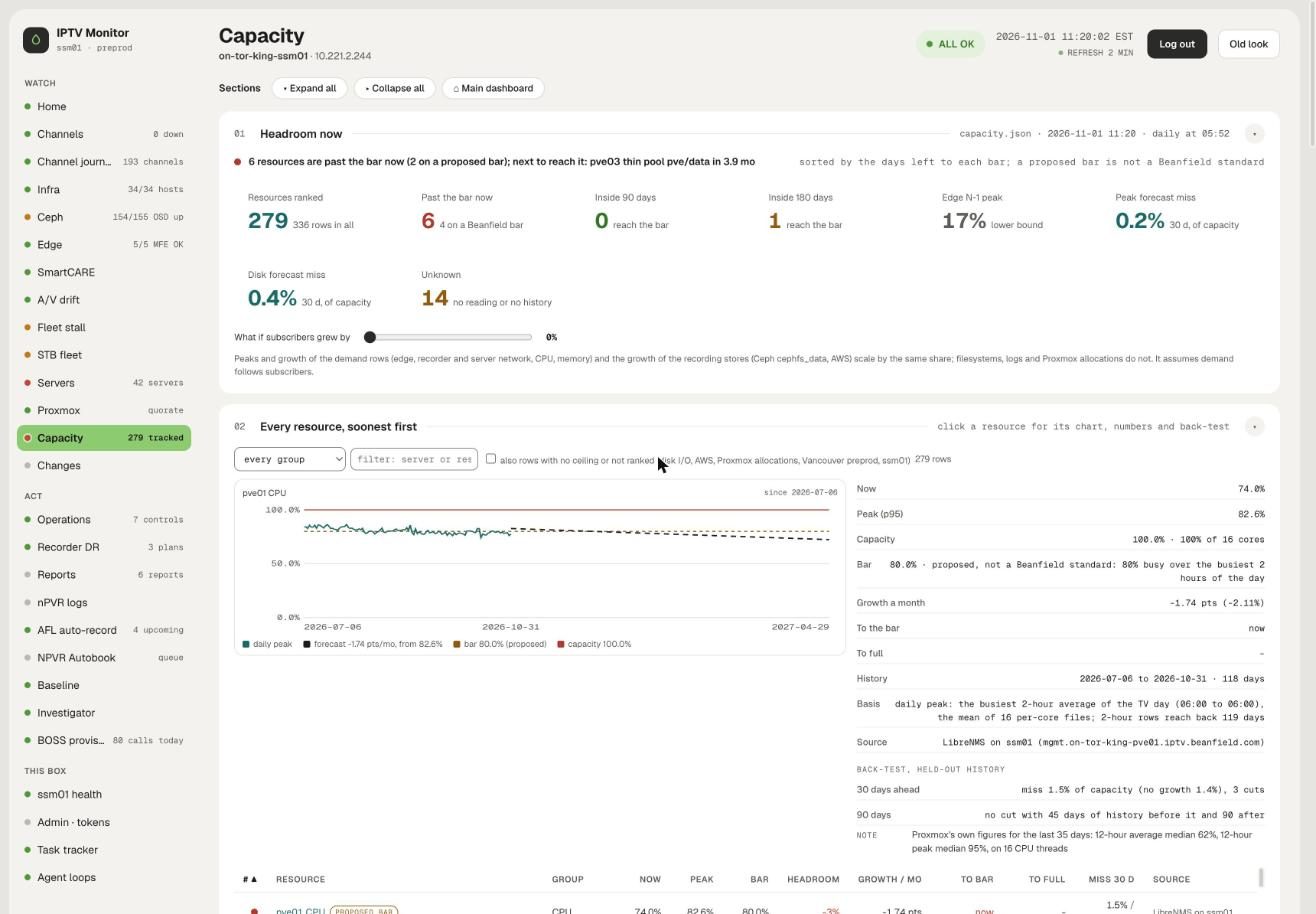
Capacity: headroom and time to exhaustion, back-tested
Every 30 s asks SmartCARE for recorder error events per channel. One fault code 5 times in 2 minutes crosses the line (code 184, no picture, needs 10). It must stay over the line 30 minutes before a red card; reminder every 4 h; a green RECOVERED card after 5 clean minutes, only if a red card went out. Self-restarts after 20 failed polls.
Codes 10000 no source, 184 no picture, 10002 timing, 10021 stream fault (red); 10019, 10017 (yellow, web only)
Detector
Source dead
Reads each recorder's incoming feed rate every 10 minutes; 0 Mb/s is a dead source. Its card shows how many people are watching right now (SmartCARE sessions, last 5 minutes) and always writes a recovery row.
Detector
SmartCARE feeds A to D
Polls SmartCARE every 60 s: A, recorder reports a channel broken at source; B, fleet KPIs against a 7-day same-hour baseline (median and MAD); C, SmartCARE itself stopped collecting; D, per-box alarms. "SmartCARE computes, the monitor polls": no heavy load on production.
Detector
Feed bitrate
Ingest bitrate per channel. Of 658 dips since 8 Aug, 604 were single-run blips, so it waits for 2 runs in a row: about 1.8 cards a day instead of about 20. Web only.
Detector
Playout wedge
Reads recorder and edge logs every 30 minutes for stuck playout: encryption wedges, video-slice errors and manifest stalls. A pairing rule drops the normal start-up pair (proven 56 of 56) and the probe's own traffic is filtered out (it had created 65 to 86 false candidates a run).
Detector
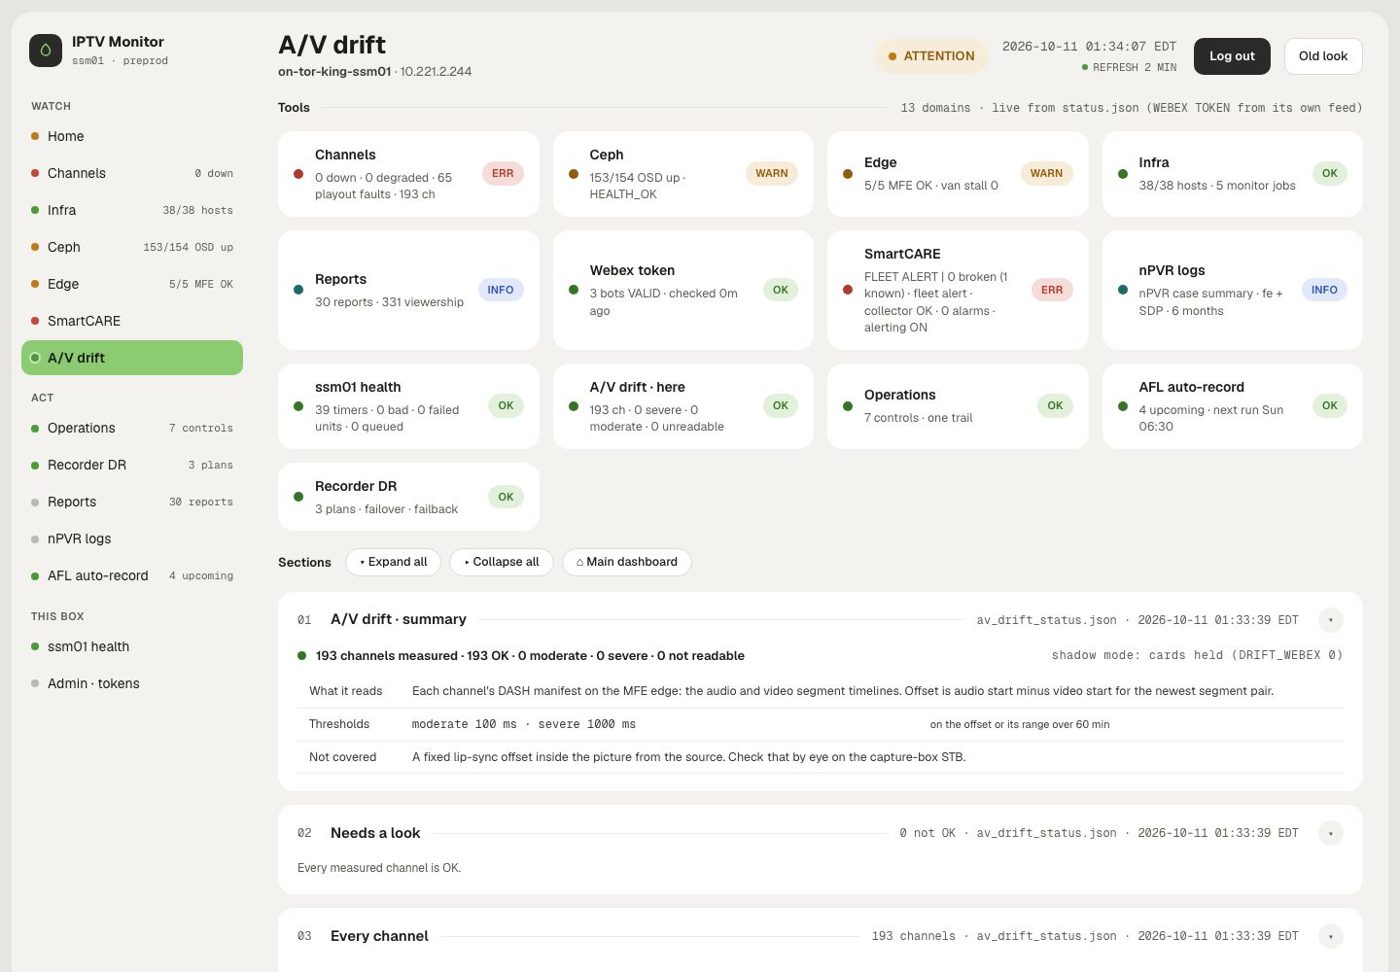
A/V drift
Audio minus video start offset from every channel's DASH manifest, 4 workers, about 11 s a run, all 193 channels. OK under 100 ms, moderate from 100 ms, severe from 1,000 ms. When it cannot read, it says BLIND, never a false OK.
Detector
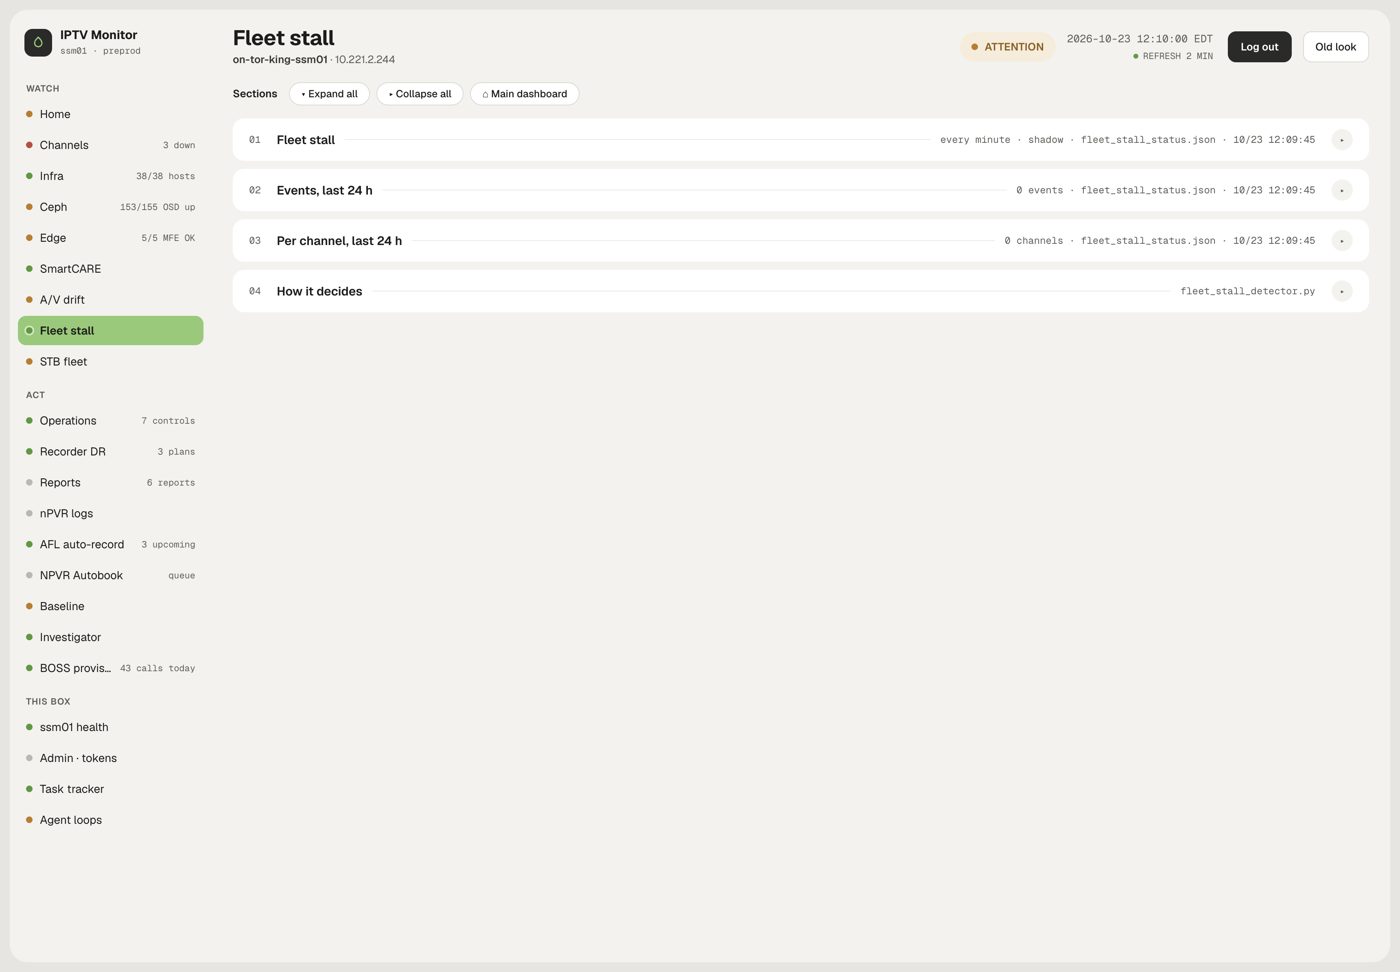
Fleet stall
Reads set-top-box buffering from ELK. Five or more homes stalling within 60 s on one channel, with the recorder showing an input break in the same window, is an event; more than 3 channels at once is one platform card. Replay mode proved it on four real past events before it could post. Baseline: 68,621 stalls over 14 days.
Page
Channel journey
Each channel hop by hop, source, recorder, storage, edge, viewers, with "starts here" on the first hop where a fault begins. Every 5 minutes, read-only. One reading saw 1,101 boxes on 129 channels.
Page
Wall View
A live picture of the 8 TV-wall screens about every 15 s, plus a 3-minute live video on request (12 fps, GPU encoding) that stops itself.
Alerting you can trust
Gate
Mass-outage gate
Ten or more channels down within 5 minutes: per-channel cards are held and one MASS OUTAGE card is posted, with progress cards and one ALL CLEAR. 211 cards in 41 minutes become 5. Sits at the single send point and fails open.
Gate
Pre-post gate
Before any card reaches the management-facing space: held long enough, agreed by a viewer-facing signal, complete with the channel number and name. Every pass or hold is logged.
Routing
Five Webex bots
Channel monitor, infra monitor, investigator, wall control, EMS catalogue. One send point picks the bot and space; an unknown target drops and logs, never falls back. Each bot's credential is checked every 6 hours.
Control
Detection parameters
86 tunable settings, each with bounds and a reason, edited from the GUI and applied by a validator. Suppress a channel for 24 h, clear a wedge, kill switch and shadow mode, with "ALERTS HELD" shown on every page.
Watchdog
Freshness and bot health
Every feed file must be fresh (cadence times 3) or one critical card goes out. A shared write library stamps every feed; a broken alert path fails loudly.
Watcher
Dashboard watcher
Watches the dashboard's own problems and sends new problems, recoveries and a 07:30 and 18:00 digest to me.
Infrastructure
Storage
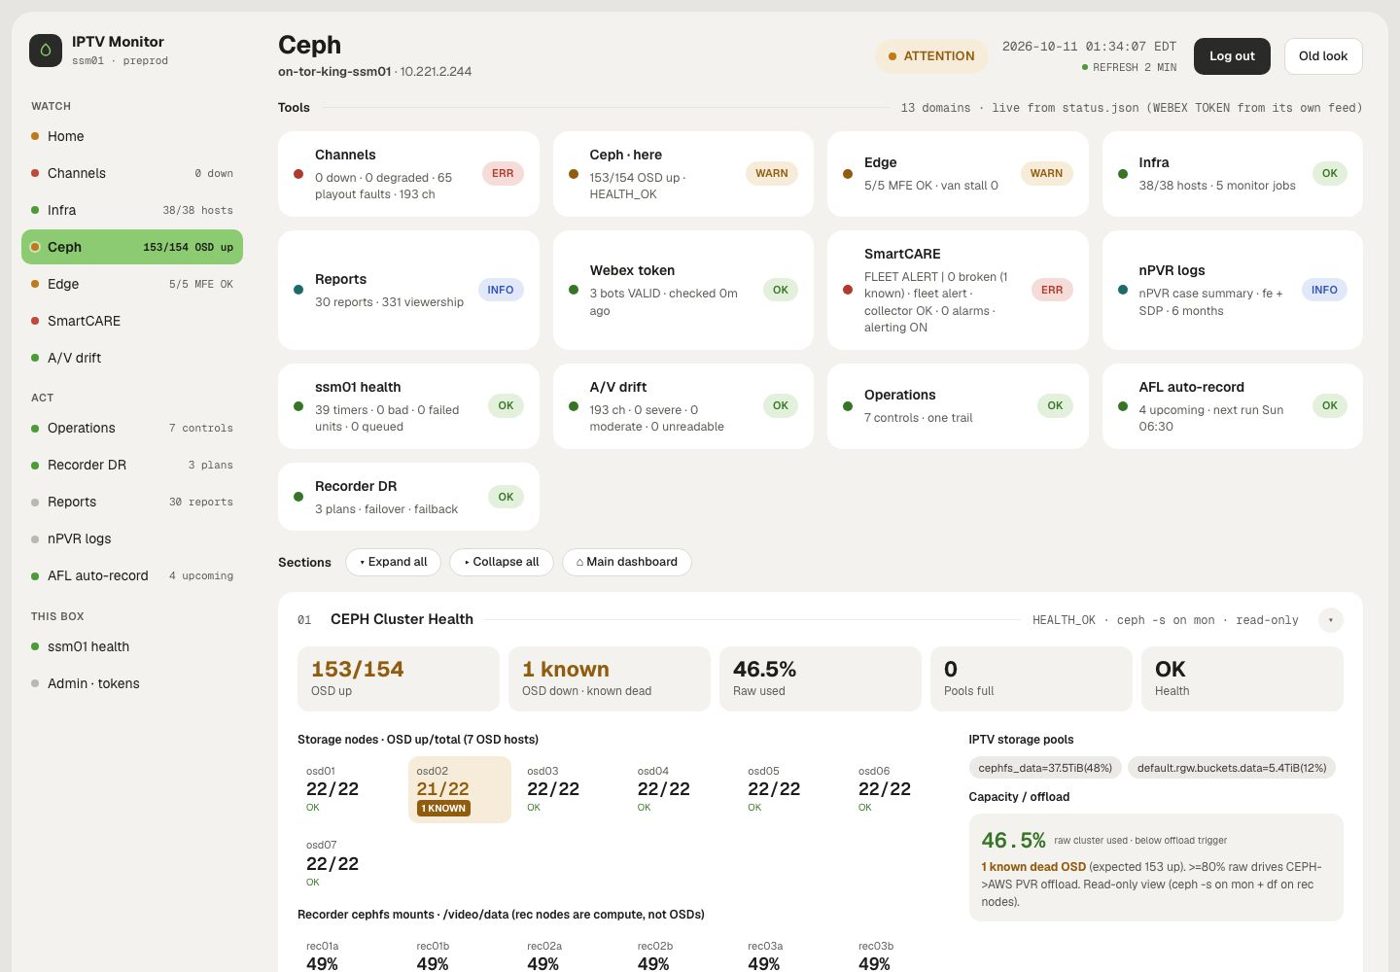
Ceph guard, platform watch, vendor watch
Ceph guard every minute (one read, about 2 s) posts on any OSD change. Platform watch is the single platform-outage card every 5 minutes. Vendor watch reads new logins and config checksums on 35 platform hosts so any change on a vendor box is noticed.
Capacity
Days to Full and Capacity
Days until storage pools and recorder disks fill, from the last 30 days' net growth; first reading 917 days for the main pool. The Capacity page adds edge and recorder egress, Proxmox commit with one node out, and a subscriber what-if slider.
Fleet
Servers, Server, Proxmox
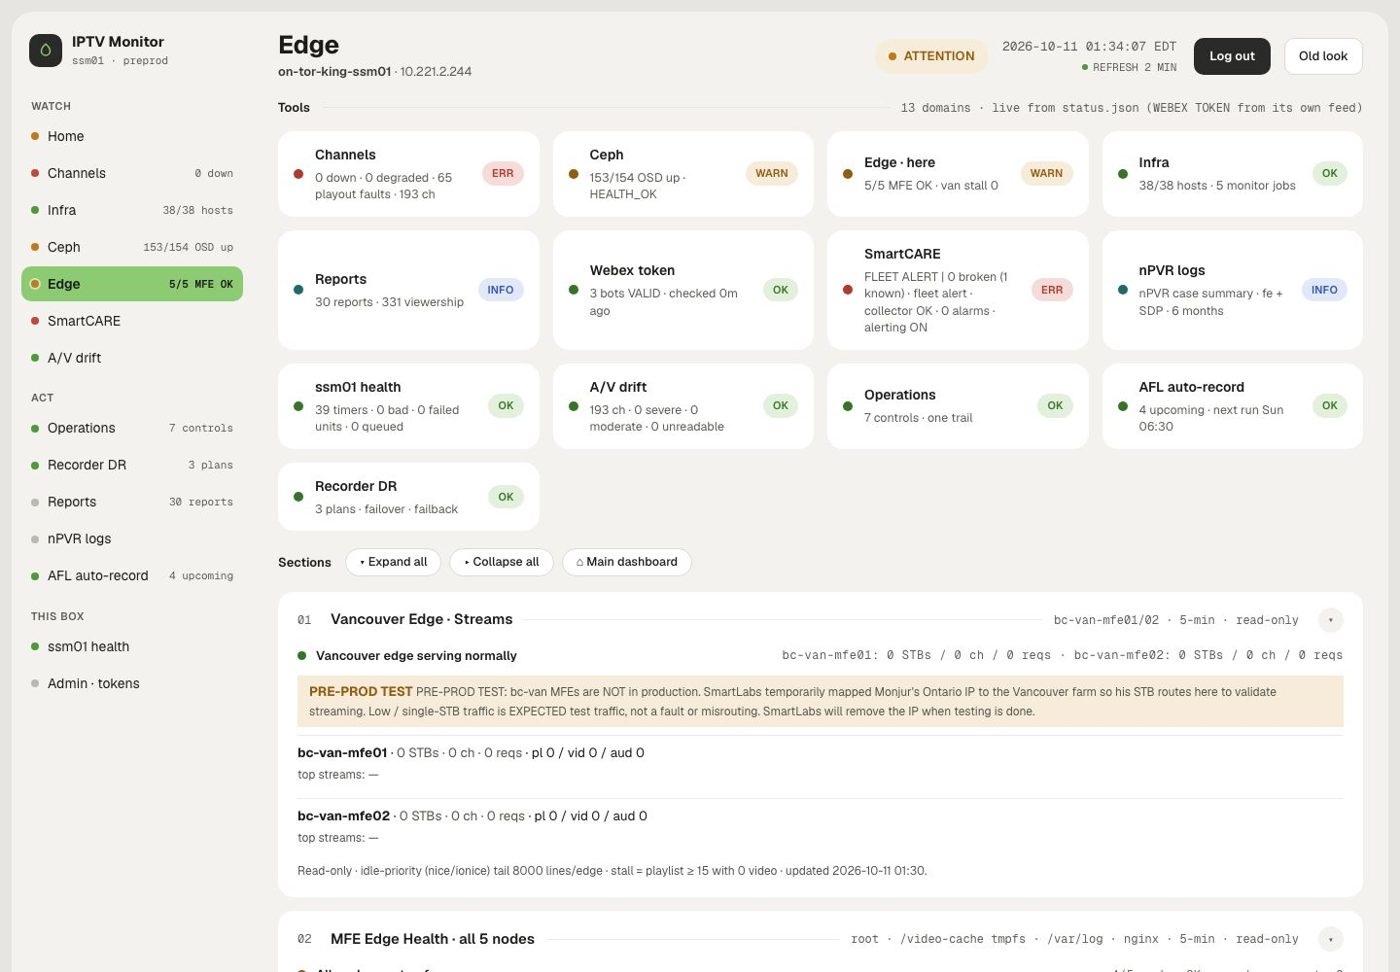
Every 5 minutes merges SNMP (LibreNMS), the Proxmox API and a light low-priority probe into one graded view of 42 servers; per-host pages with 12 sections; a CPU heatmap; an "alert shadow" showing what would alert.
History
Changes
One 90-day timeline from 11 sources of every change, alert and event, and "what changed in the 2 hours before any alert", with replay of marked events.
Guide
EPG request health
Counts guide answers over 200 bytes each hour against the same hour on the last 7 days, because about two thirds of guide requests are empty on a normal day.
Baseline
Live service check
Every 30 minutes, one verdict per service line: live TV, nPVR, provisioning, auth, catch-up, telemetry, guide, platform. Plus a daily config-drift sweep and a weekly end-to-end golden trace.
DR
Recorder DR
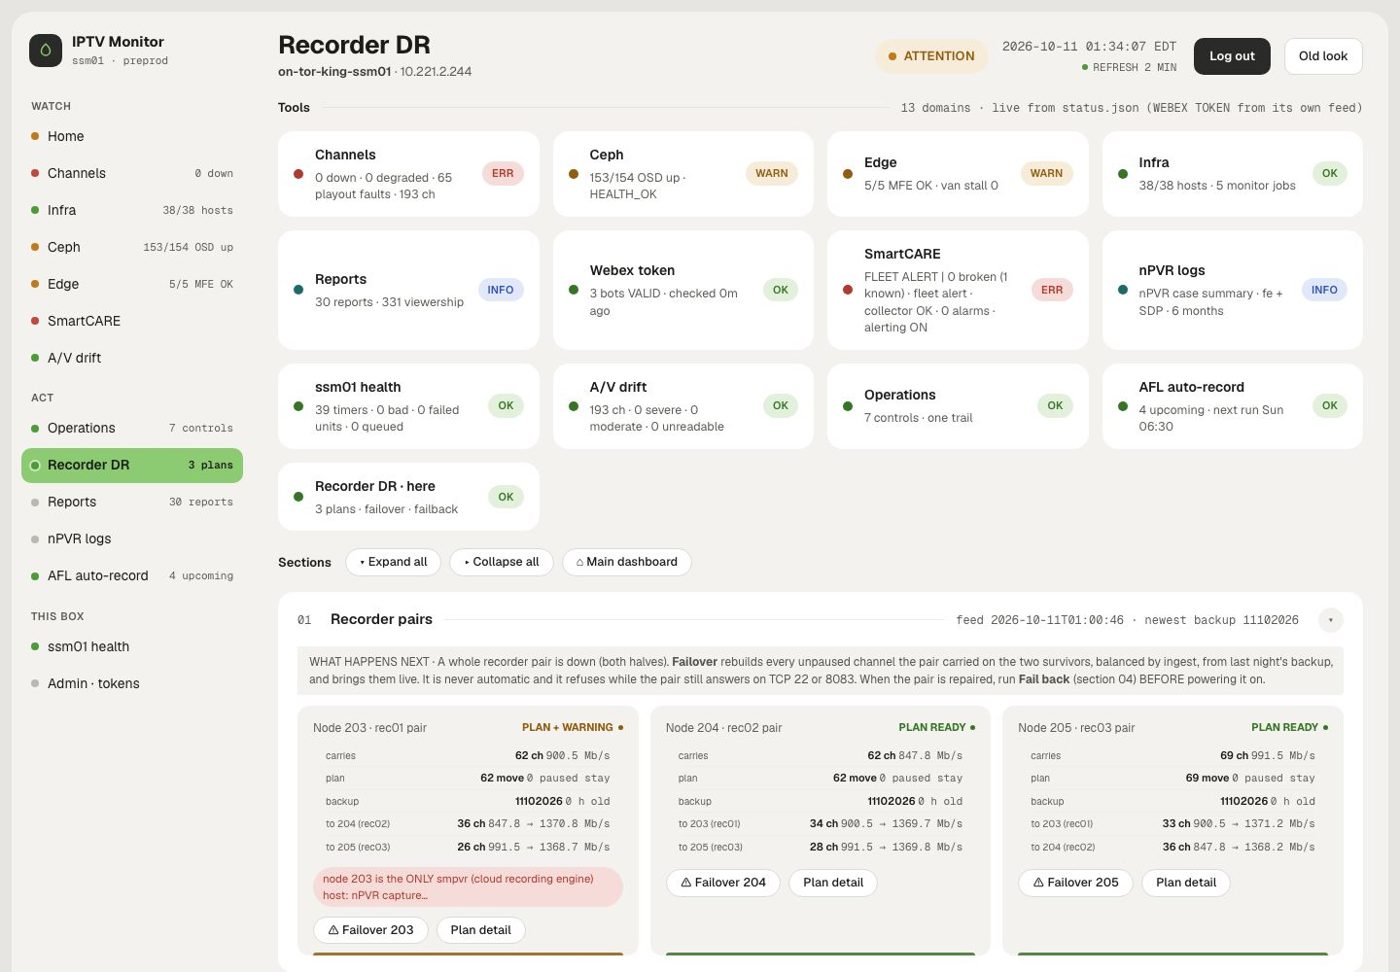
Recorder pair failover and failback from the browser: typed confirm phrase plus admin sign-in, live progress, plan rebuilt nightly. Refuses while another run is active.
Customers, recordings and reports
Provisioning
BOSS provisioning monitor
Every 5 minutes joins platform errors to the billing request on the same thread, because the gateway answers HTTP 200 either way. After each failure a read-only investigator posts one card naming which side owns the fix. Cross-checked: 161 calls equal 80 plus 81 request lines.
Recordings
nPVR Autobook
Books every airing of a programme a customer names, including sports that move between channels. Nothing books until I approve it on the page; at most 20 recordings a run.
Recordings
nPVR logs and services
Six months of recording-service logs searchable by account, box or rule, with a case summary and a "next step" per error. Quota pre-warn at 85%, rule health, sticky-recording detector, AFL auto-record.
Support
Investigator bot
Mention it in Webex with a box ID and it answers with sessions, picture quality, errors, recordings and plan; restarts and tune commands are allow-listed and verified from three sources.
Reports
Viewership reports
Daily, weekly and monthly channel reports from SmartCARE viewing data, an executive dashboard, and the Monday report email to the senior director.
Wall
Nexto TV wall control
8 screens, 72 channels at once, changed from Webex in plain words ("cp24 on 1 and cnn on 2"); five themes; verified reset in 38 s. Case study
Engineering ideas worth asking me about
No false alerts in the management space. Three pre-post checks; indirect signals fail closed, viewer-facing ones fail open.
Confirm hold, and a recovery only after a real red card. A flap that clears inside 30 minutes never cards.
One send chokepoint where the mass-outage gate lives, so no detector can bypass it.
UNKNOWN is never OK. "Running is not working": unmeasured is a first-class state.
Shadow first, replay before arming. A new detector proves itself on past events before it may post.
Same-hour baselines, not fixed thresholds (guide answers, fleet KPIs).
Write-only request queues. The browser can ask for a change but never read the queue; a job validates and applies.
Approval gates on anything that books or fails over.
Automatic first-pass investigation of every provisioning failure.
Read-only on production by construction, paced, with a named User-Agent on every probe and no heavy reads in prime time.
Back-tested forecasting that refuses to give a number on too little data.
Contracts, drift checks and git-first deploys with rollback keep 319 host destinations matching git.
Architecture
Four planes on one host: collectors, engine, web GUI, runtime.
One monitoring host runs a long-running engine, about 68 timers for collectors and detectors, and two containers (the GUI web server and the wall bot), all as an unprivileged user with systemd hardening.
Data flow: jobs write small status files; pages read them; the browser can only send requests into four write-only queues.
Git-first deploy: edit on the workstation, commit, run the component's deploy script. It checks the code, waits for CI, installs, restarts only what changed, verifies inside the unit or container and rolls back on failure.
Drift control: a sweep compares the host with git (CLEAN on 319 destinations, 4 Sep 2026). Contracts define "working" for every job and page, run by a live runner.
Backups: databases kept 14 days on the host, pulled nightly off-box at 04:00 and kept 30 days with an integrity check.
Access: IPTV VPN only, sign-in on the whole GUI, read-only toward every production server.
Design and quality
Two looks from one set of files. I picked Elera from a mockup canvas on 10 Oct 2026; every Elera rule is scoped so it never edits the original look; the theme is applied before first paint, so no flash.
Accessibility checked by tools: 8,557 text elements on 14 pages, none under 4.5:1 contrast; 336 of 336 overflow checks clean from 320 to 1,440 px wide.
A change is done only when a screenshot after deploy shows it working, in every look.
Plain, honest UI: "no data" is explained, yellow is not red, shadow and dry-run badges, a "what happens next" note on every control, typed phrases for destructive actions.
Security: a security review and hardening release (26 Oct 2026), a CI scan that blocks committed credentials, a hardened web server.
Timeline
7 Aug 2026
First commit: four planes, collectors, engine, multi-page GUI
9 Aug
First major vendor outage detected in 81 s; mass-outage gate and 11 findings follow